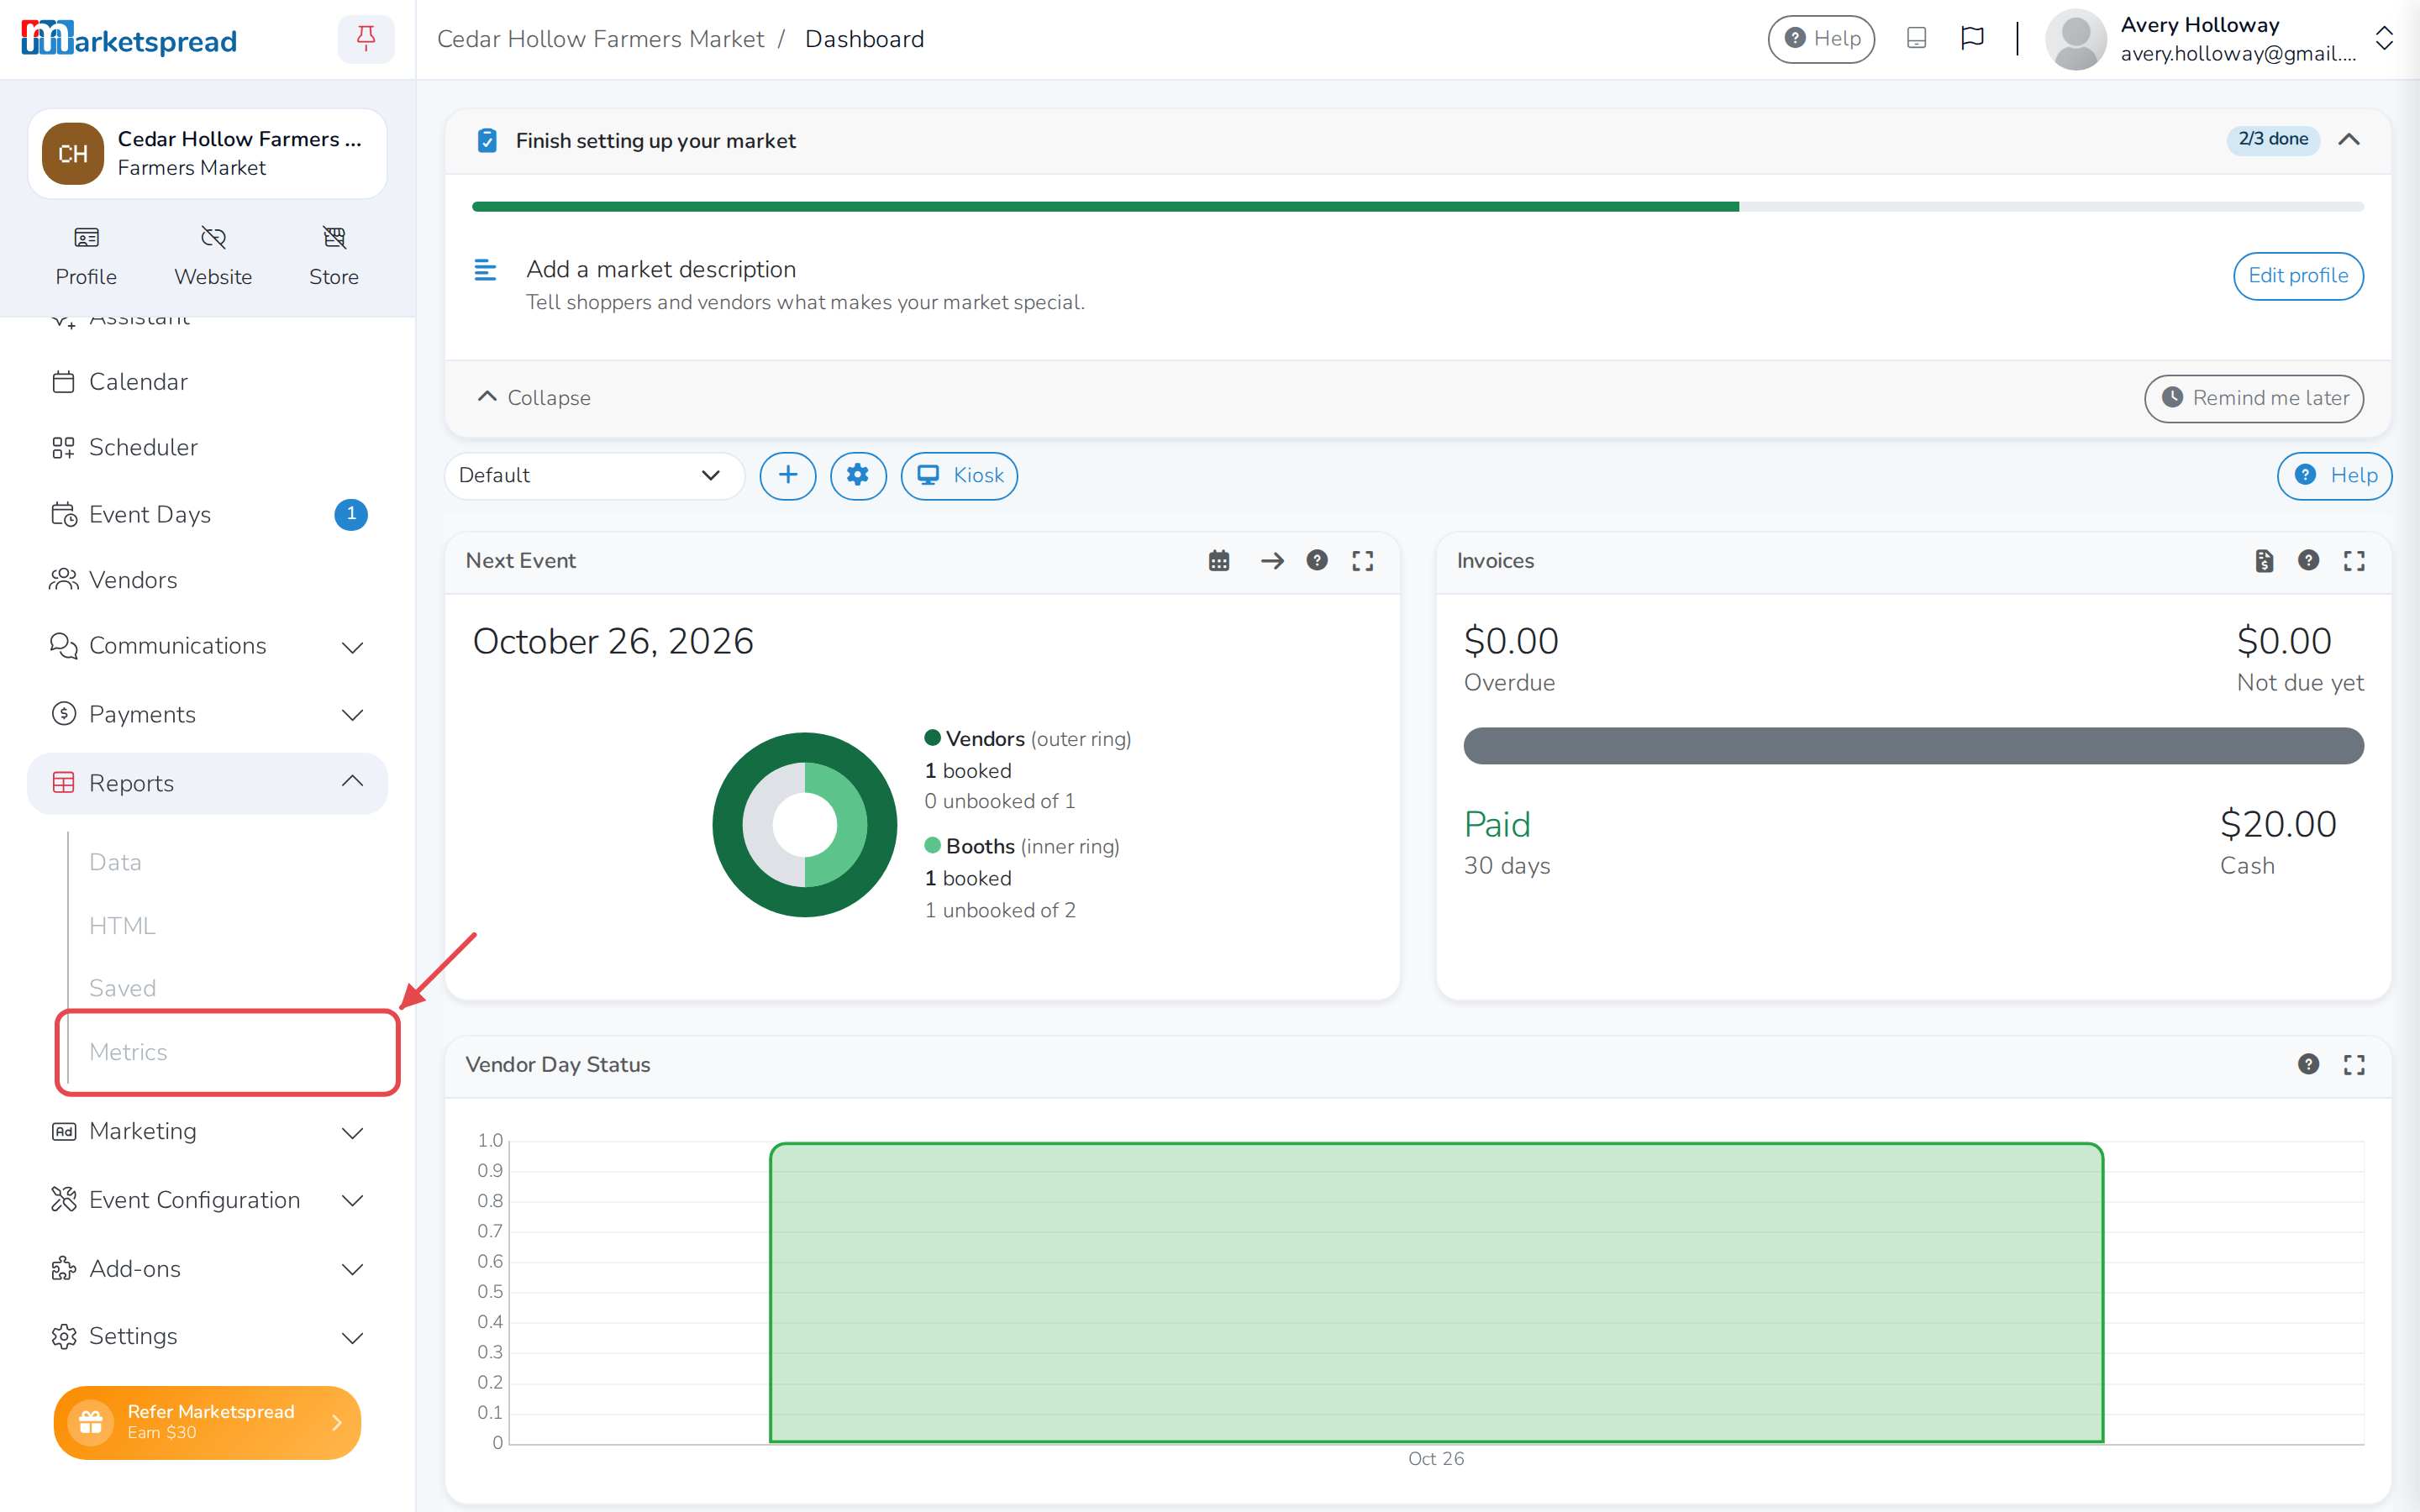
Metrics gives you dashboards built from your event data — for sales, vendors and invoices. Open it from your left sidebar.
Open Metrics
Click Reports in your left sidebar. Then click Metrics.
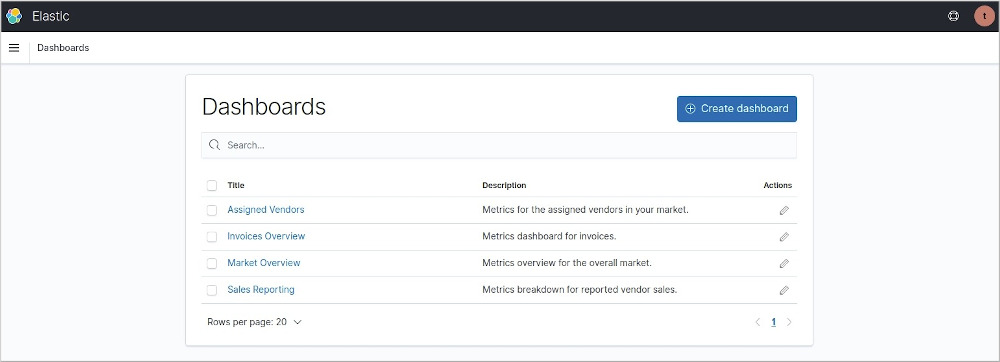
Metrics opens in a new tab, with four dashboards already set up:
- Market Overview
- Assigned Vendors
- Invoices Overview
- Sales Reporting
To add more dashboards or customize one, open a support ticket.
Open a dashboard
Click a dashboard's title to open it.

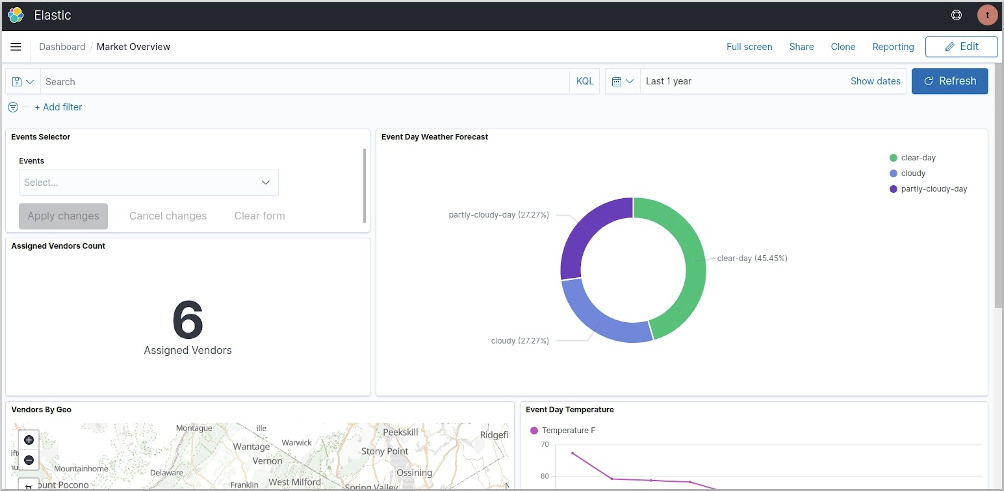
Switch to a different dashboard
Click Dashboard at the top of the page to get back to the dashboard list.

Change the date range
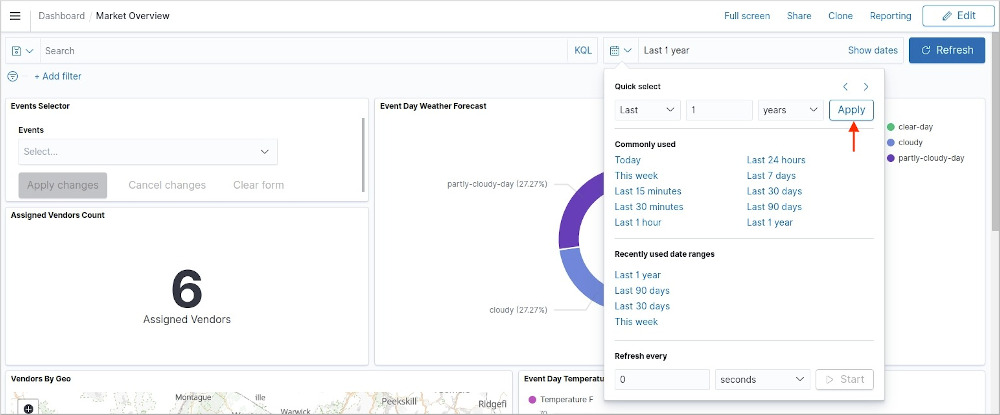
Click the calendar icon to open the date selector.

Choose a range under Quick select or Commonly used. Then click Apply.
Filter by event
Each dashboard reports on every event in your date range by default. To narrow it down, use the Events Selector.
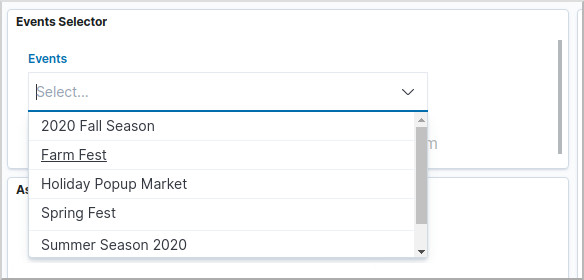
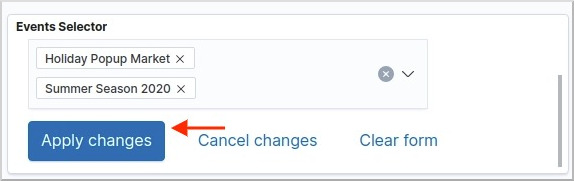
Select as many events as you want. Then click Apply changes. Below, Holiday Popup Market and Summer Season 2020 are selected.
Your filter appears in the filter bar once it's applied.
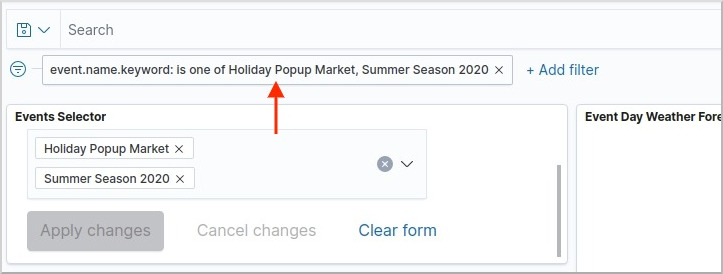
Click Clear form to clear the Events Selector — this does not remove a filter you've already applied.
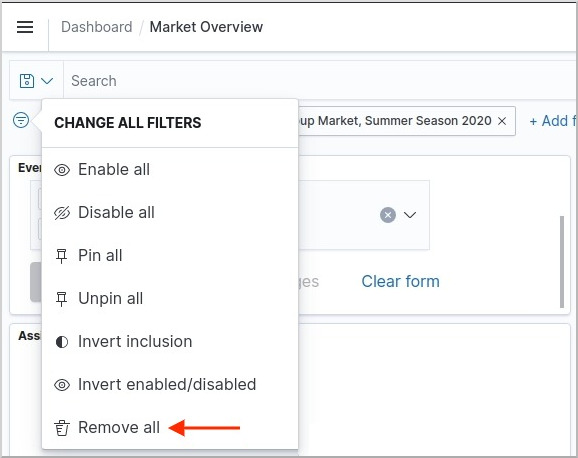
To remove an applied filter, click the icon at the left of the filter bar to open Change All Filters. Then click Remove all.
Export a dashboard
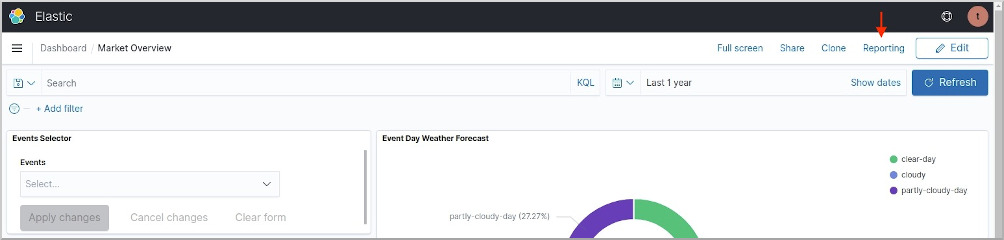
Click Reporting at the top of a dashboard.
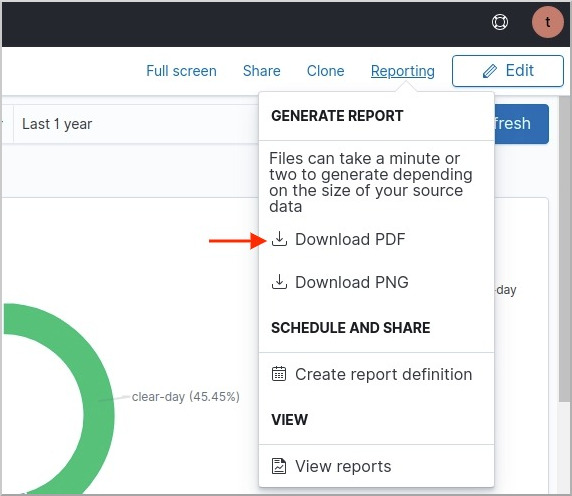
Then click Download PDF or Download PNG.
Build a custom report
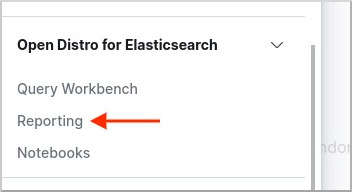
Click the menu icon at the top left.

Then click Reporting.
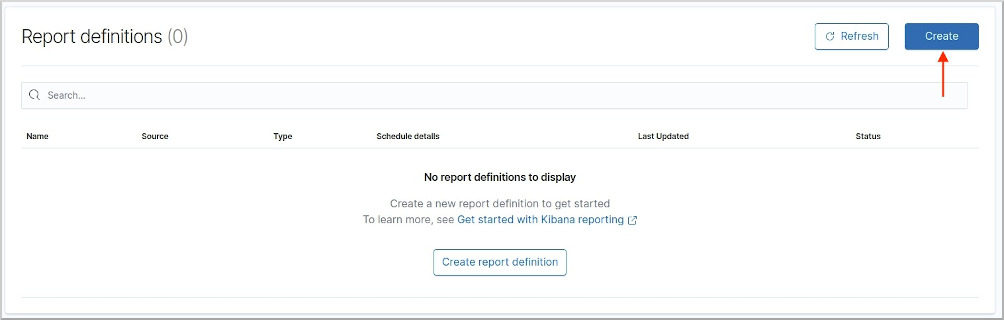
Click Create to start a new report. From there, you can customize how it looks, including its header.