


Reports in the left-hand menu opens a set of ready-made reports covering
invoices, payments, documents, applications, products and vendor sales.
None of them are fixed. You can choose the columns, reorder them, filter,
group, total things up, and save the result as your own report.
Choose the columns
Click Columns on the right and tick only what you want to see. Reports
start with everything switched on, which is usually more than you need.
Drag a column header sideways to move it. Put the numbers you compare next to
each other and the report gets much easier to read.
Filter
Either click Filters on the right, or hover a column header, click the menu
that appears, and choose the funnel.
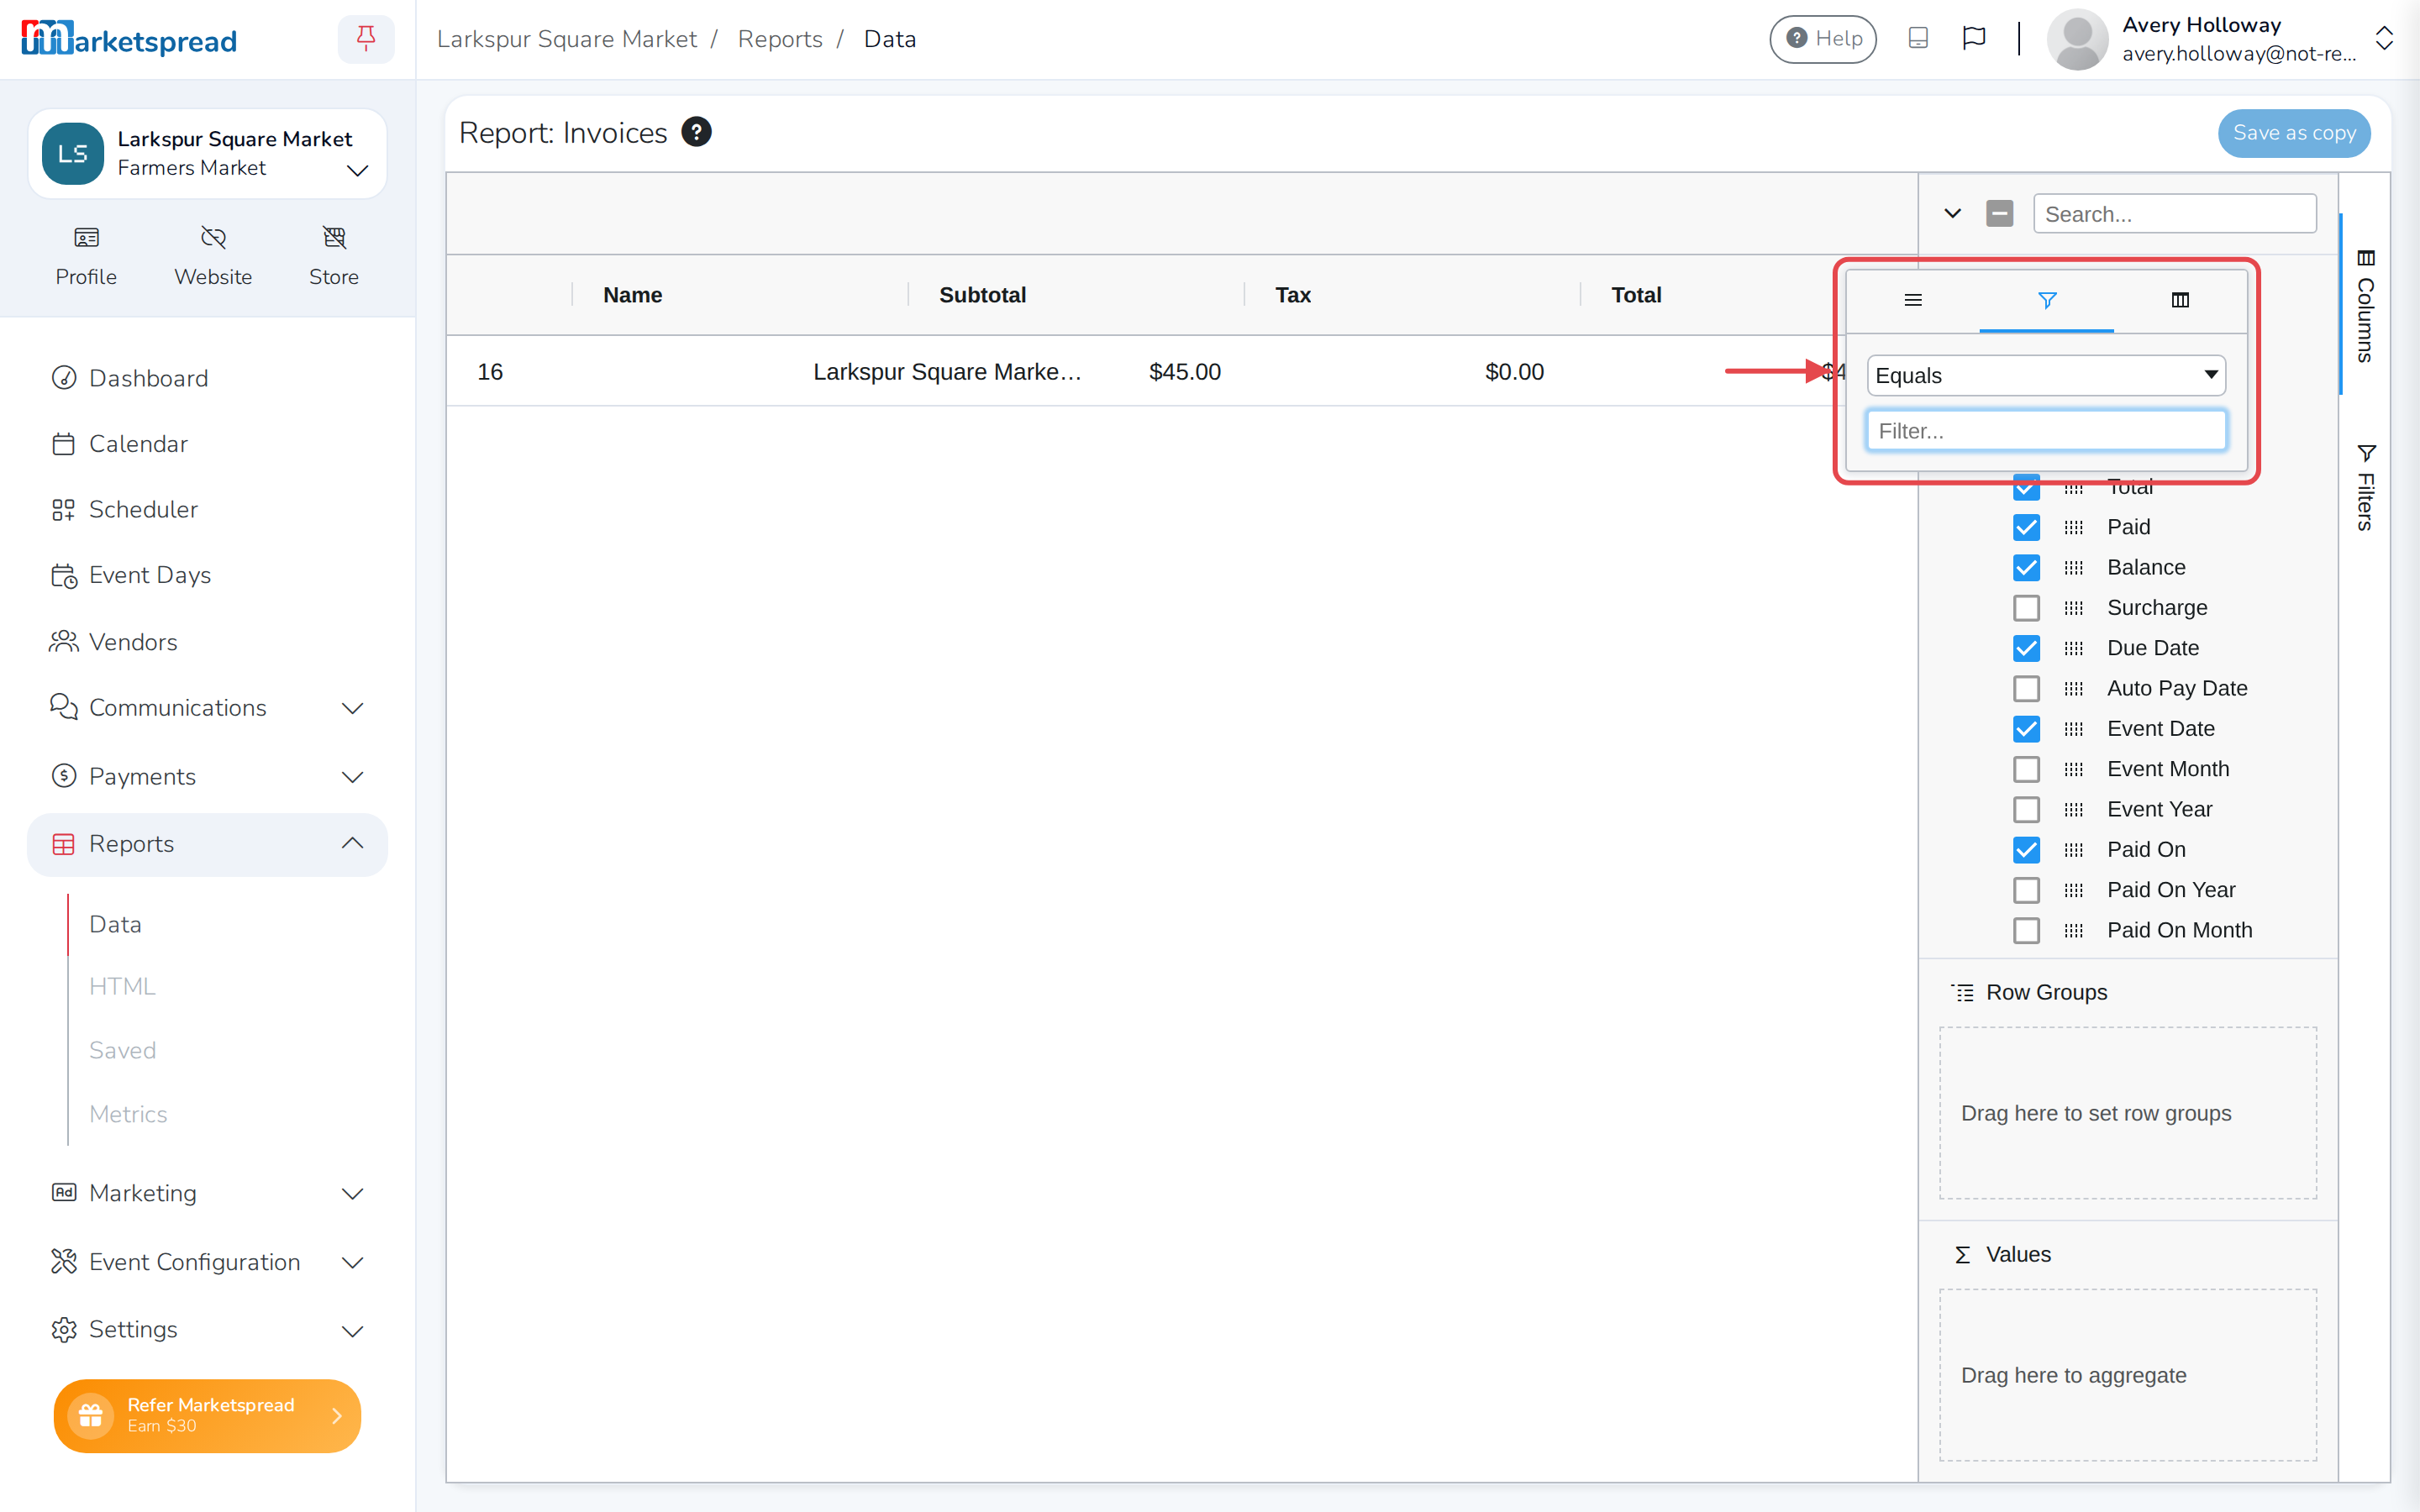
A simple contains search covers most of what you need. Filters can be
combined for narrower questions.
Group and total
In the Columns panel, drag a column into Row Groups to group by it —
by vendor, say. Expand any group to see what is inside it.
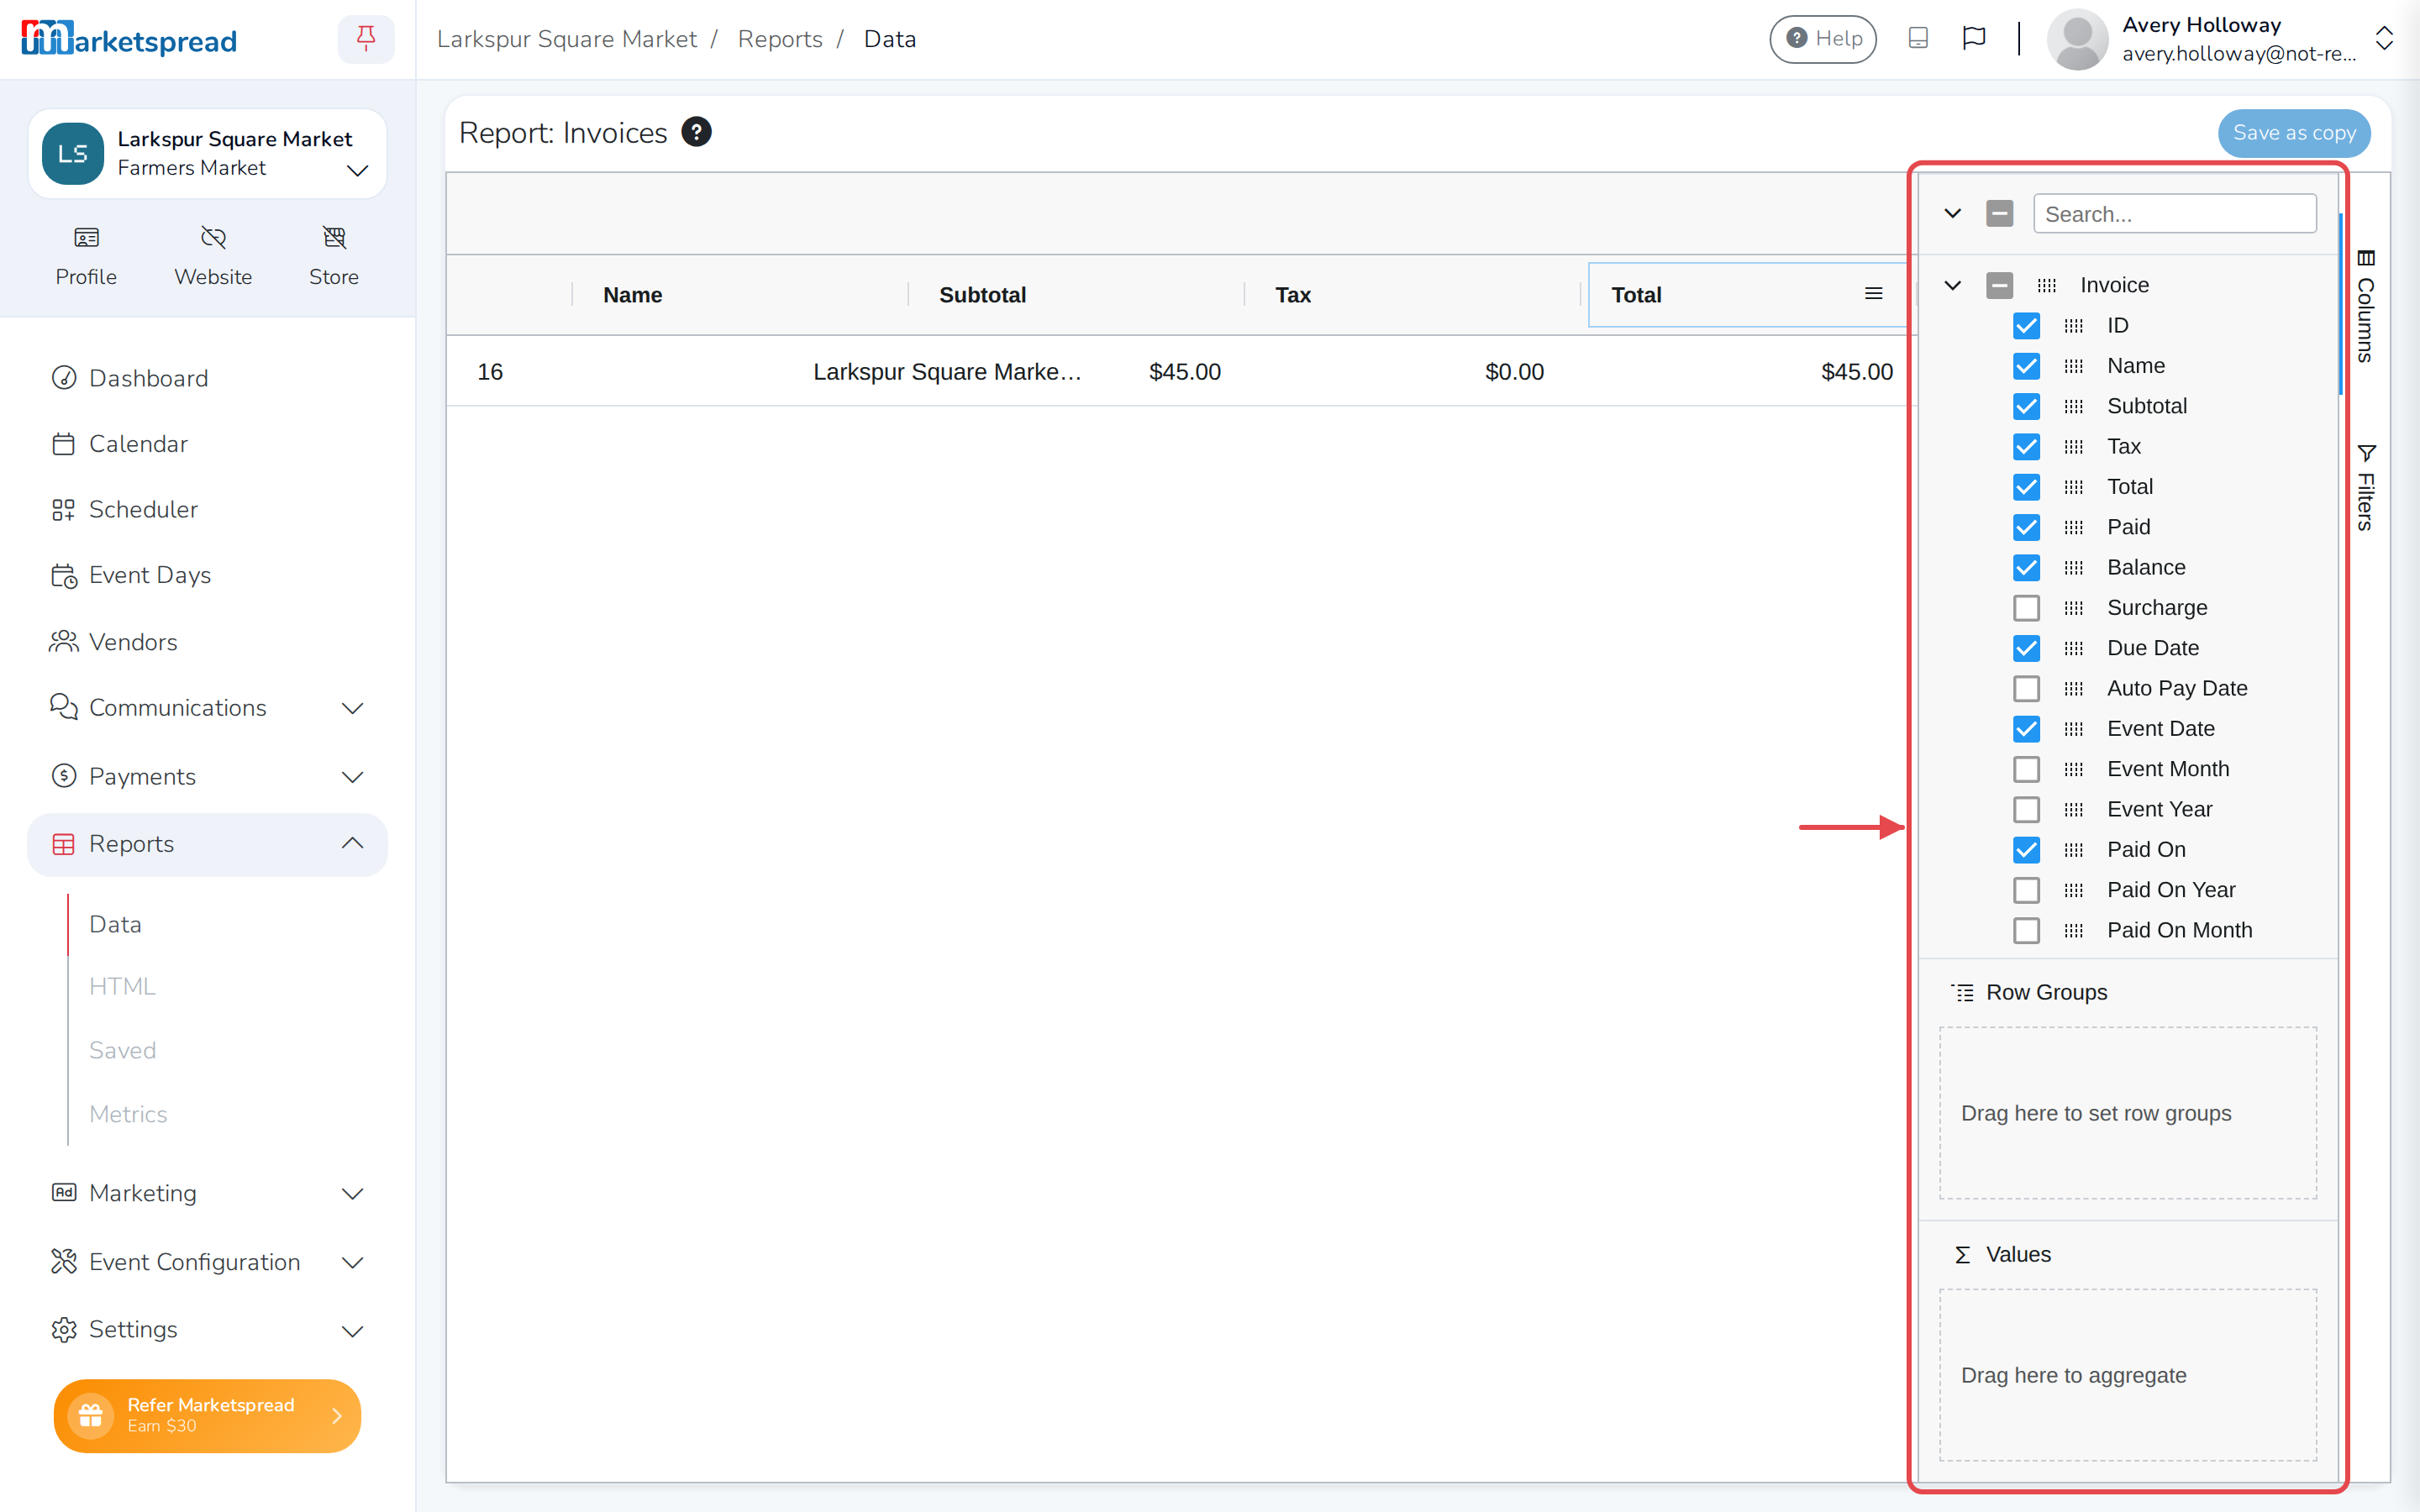
Drag a number column into the values area below to total it. Each group then
shows its own total.
Filters apply to grouped totals too, so you can total just the rows that match
something — every line tagged "rental", for instance.
Drop the column you grouped by
Once rows are grouped by vendor, the vendor column repeats what the group
heading already says. Untick it.
Jump to the thing itself
Most reports link to what they list. A row in the submitted documents report
opens the actual document; a row in submitted products opens the product. It
saves hunting for it separately.
Export
Right-click anywhere in the report and export it as a spreadsheet file, an
Excel file, or XML.
Save it as your own report
Once it looks right, click Save as copy and name it.
It appears in your reports list alongside the ready-made ones, and opens with
your columns, filters, grouping and totals already applied. You can change it
whenever you like.