

In order to better use and understand your event data, we provide a very powerful Metrics platform.
To get started
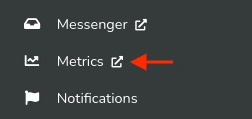
Click on Metrics from your lefthand toolbar.
This will load the Metrics platform in a new tab. Once loaded, you will be presented with a set of preconfigured Dashboards.
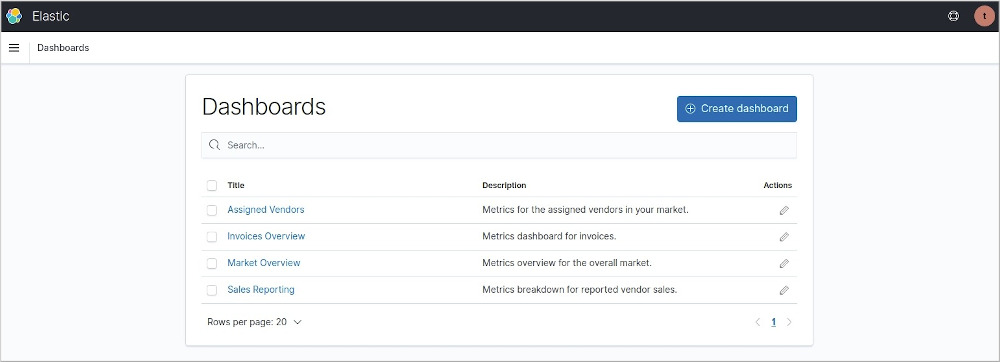
By default we offer four Dashboards:
- Market Overview
- Assigned Vendors
- Invoices Overview
- Sales Reporting
Additional dashboards and customizations can be added by contacting us at [email protected].
To select a Dashboard, simply click on the blue dashboard title.

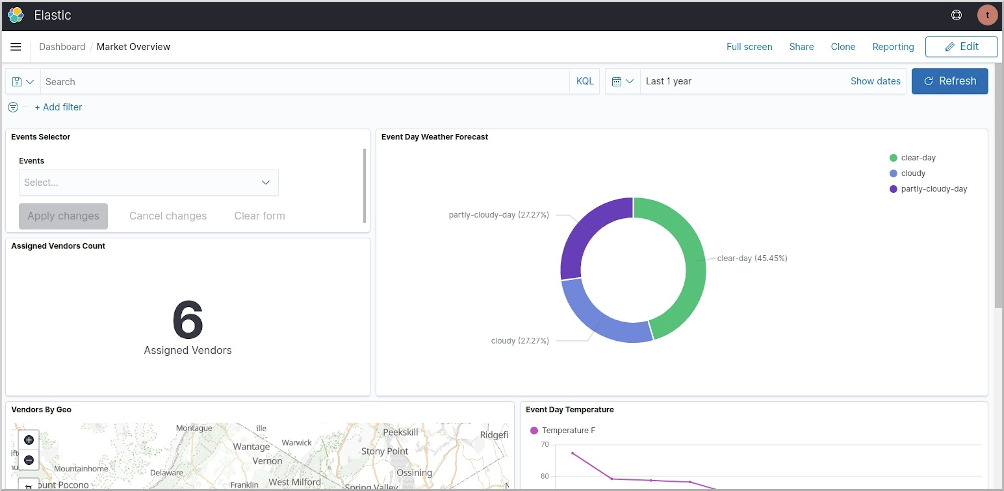
This will open the corresponding dashboard view.
Navigating a Dashboard
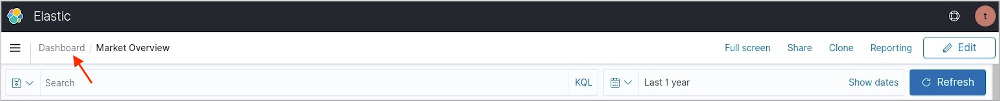
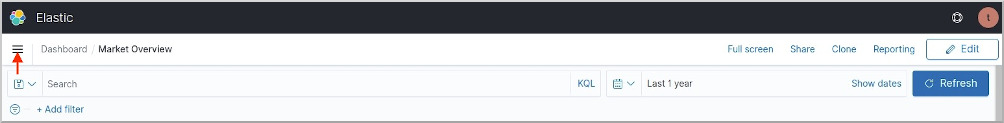
Selecting other dashboards. To get back to the main dashboard selector, click on the Dashboard link as seen below.
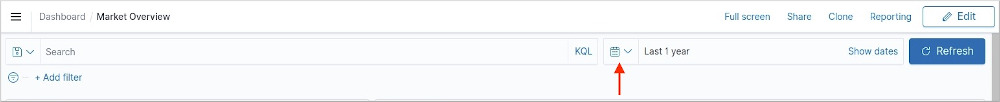
Selecting the date range to display. To select a date range for Metrics reporting click on the calendar icon as seen below.
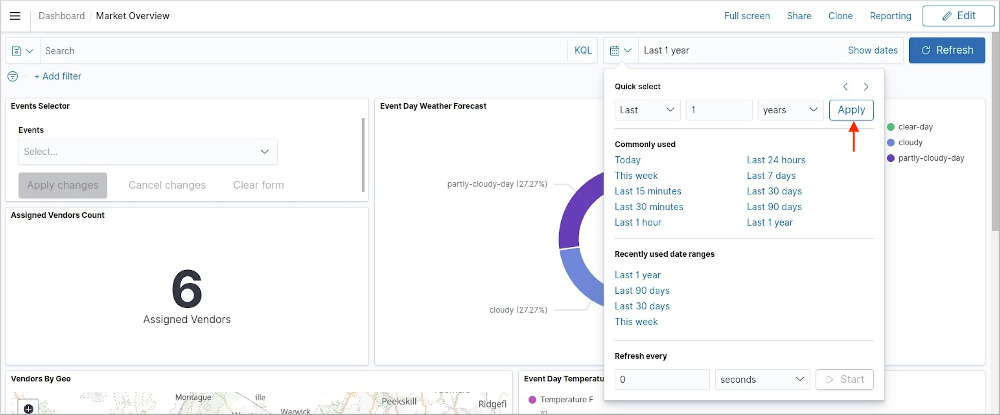
This will open the date selector drop-down menu. Use either the Quick Select or Commonly used to select your date range. Then click the blue Applybutton.
Filtering on Events with the Events Selector. By default each dashboard will report on all events within your specified date range. To filter on a specific or set of events use the Events Selector.
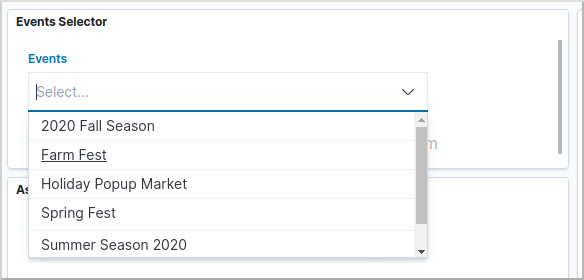
Note that you can select as many events as you want. In the example below, we selected two: the Holiday Popup Market and the Summer Season 2020. When you are done adding events to filter on, click the blue Apply Changes button.
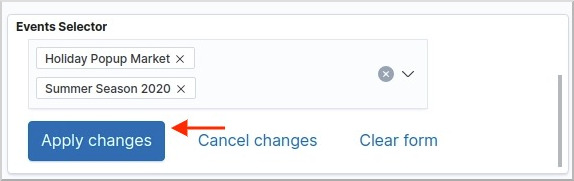
Once applied, the filters are added to the filter bar as seen below.
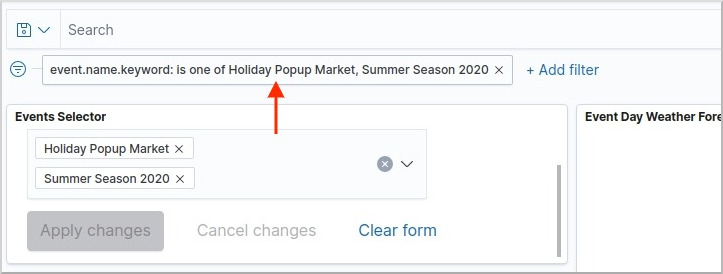
To remove the filters from the Events Selector click on the blue Clear form. This will not remove the currently applied filter.
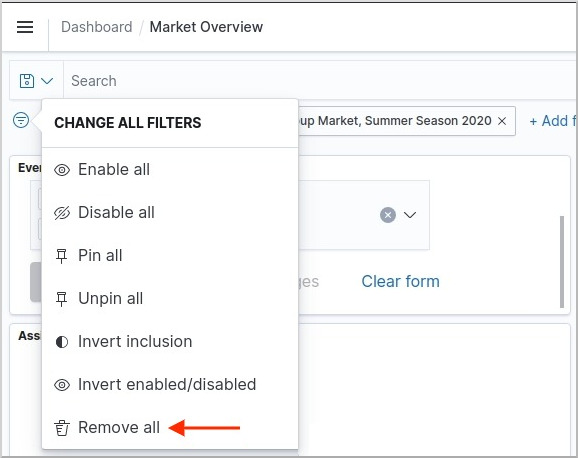
To remove the currently applied filter, click on the filter icon to the left of the filter bar. This will display the Change All Filters dropdown. Then click on the Remove all option.
Metric Report Export
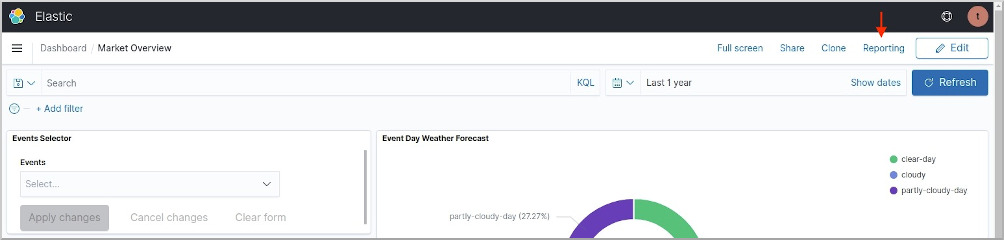
Exporting Dashboard to a PDF or PNG. You can generate a pdf or png of a dashboard by clicking the blue Reportinglink at the top right of the Dashboard page.
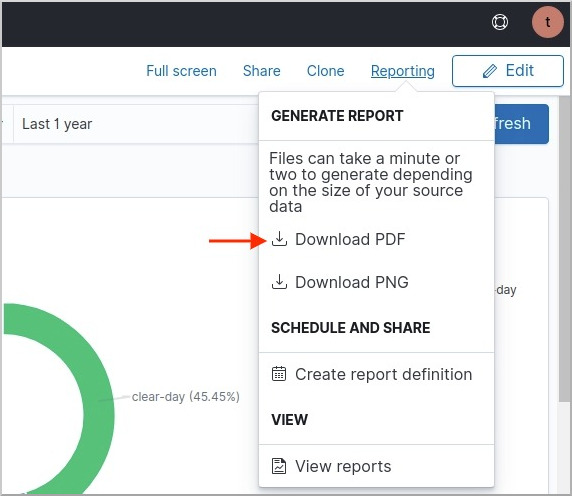
This will open a report panel as seen below. Choose whether you would like a pdf or png export by click on either of the two option.
**Custom Reports.**You can create custom reports by clicking on the three dash icon at the top left (see below).
Then select the Reporting option (see below).
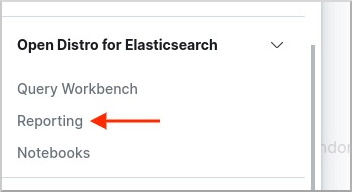
From there click on Create to start building a new Report.
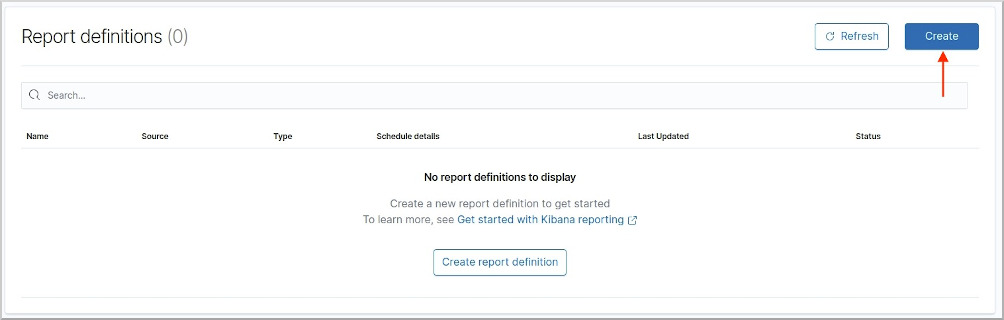
Here you can specify some specific on how you would like your report to look. In particular, it is a great way to customize your report header.